WEGAN (Web-based Ecological Group Analysis) is a free, user-friendly tool for analyzing ecology data. It can help with exploratory data analysis; diversity, ordination, taxonomic comparisons; and generating statistics and figures for use in publications. It is powered by R and useful for those less familiar with R programming.
WEGAN was designed primarily for community abundance data, in the form of tables commonly recognizable with sites or samples in rows and species or taxa in columns. If your data has these in reverse (i.e. the species in rows and sites in columns), indicate so on data upload. The Plotting and Correlation modules can process categorical data along with numeric data in the same table, but all others must be community abundance data. For sample files and format specification, please see "Data Formats" for more details.
Yes. The data files you upload for analysis as well as any analysis results, are not downloaded or examined in any way by
the administrators, unless required for system maintenance and troubleshooting. All files are deleted from the server after no
more than 72 hours, and no archives or backups are kept. You are advised to download your results as an zip immediately
after performing an analysis.
Missing values should be presented either as empty values or NA without quotes.
Any other symbol will be treated as string character and will cause errors during data processing. WEGAN offers a variety of
methods to deal with missing values. Missing values must be dealt with during the data upload phase. This decision was made to streamline the user interface and available analysis methods provided. Be aware that by default, missing values are replaced by half of the minimum positive values detected in the data, which may or may not be appropriate for your analysis goals. Users can also specify other methods, such as replace by mean/median,
Probabilistic PCA (PPCA), Bayesian PCA (BPCA) method, or Singular Value Decomposition (SVD) method to impute the missing values
(Stacklies W. et al).
Potential outliers can be identified from PCA or PLS-DA plots. The scores plot can be used to identify sample outliers,
while the loadings plot can be used to identify feature outliers. The potential outlier will distinguish itself as
the one located far away from the major clusters formed by the remaining.
To deal with outliers, verify correct sample measurements. If those values cannot be corrected, they should be
removed from analysis. WEGAN provides DataEditor to enable easy removal of sample/feature outliers.
Please note, you may need to re-normalize the data after outlier removal.
This implies WEGAN failed to execute the command using the given parameters. Users should try to adjust parameter values.
We found in most cases, the problem is associated with sample size. In particular, if the sample size is very small (below 10),
some unpredictable error may happen. For instance, by default PCA and PLSDA will try to generate summary/classification/permutation
plot for the top 5 components, if the sample size is too small, it will fail to do so.
There are several unsupervised methods (PCA, hierarchical clustering, SOM, K-means) that can be used to detect
inherent patterns in unlabeled data. However you need to trick WEGAN to accept the data by providing
dummy two-group labels . In this case, results from feature selection or supervised classification methods
will be meaningless.
Generalized logarithm (glog) is a simple variation of ordinary log in order to deal with zero or negative values in the data set.
It has many desirable features (for details, see Durbin BP. et al
Its formula is shown below:
where a is a constant with a default value of 1.
The purposes of data editor and data filter are to help improve the quality of data for better separation, prediction or interpretation.
In particular, user can use data editor to remove outlier(s) which can be visually identified from PCA or PLS-DA scores plots);
user can use data filter to remove noisy or uninformative features (i.e. baseline noises, near-constant-features). These features
tend to dilute the signal and decrease the performance of most the statistical procedures. Be removing outliers and low-quality features,
the resulting data will be more consistent and reliable.
In a boxplot, the bottom and top of the box are always the 25th and 75th percentile (the lower and upper quartiles, or Q1 and Q3, respectively),
and the band near the middle of the box is always the 50th percentile (the median or Q2). The upper whisker is located at
the smaller of the maximum x value and Q3 + 1.5*IQR (Interquantile Range), whereas the lower whisker is located at the
larger of the smallest x value and Q1 - 1.5*IQR.
The purpose of fold change (FC) analysis is to compare absolute value change between two group averages. In paired fold change analysis,
users aim to find some features that are changed consistently (i.e. up-regulated or down-regulated, but not both) between two groups.
The consistency is measured as a percentage - (# of pairs with consistent change above a given FC threshold) / (total # of paired samples).
Users need to specify two thresholds - fold change threshold and significant counts (the percentage).
There are two variable importance measures in PLS-DA. The first, Variable Importance in Projection (VIP),
is a weighted sum of squares of the PLS loadings taking into account the amount of explained Y-variation,
in each dimension. Please note, since VIP scores are calculated for each components, when more than components
are used to calculate the feature importance, the average of the VIP scores are used. The other importance measure
is based on the weighted sum of PLS-regression. The weights are a function of the reduction of the sums of squares
across the number of PLS components. Please note, for multiple-group (more than two) analysis, the same number
of predictors will be built for each group. Therefore, the coefficient of each feature will be different depending
on which group you want to predict. The average of the feature coefficients are used as the overall coefficient-based importance.
It is well known that when there are too many variables and a small sample size, many supervised classification algorithms
tend to overfit the data. That is, even there is no actual difference between the groups, the program will still be able to
discriminate them by picking some features that are "different" between these two group by pure chance! Of course,
the classifier will be useless for new data since the pattern it detected is not real (not significant).
The purpose of a permutation test is to answer the question - "what is the performance if the groups are formed randomly".
The program uses the same data set with its class labels reassigned randomly. It then builds a new classifier,
its performance is then evaluated. The process will repeat many times to estimate the distribution of the performance
measure (not necessarily follows a normal distribution). By comparing the performance using the original label and
the performance based on the randomly labeled data, one can see if the former is significantly
different from the latter. For PLS-DA, the performance is measured using prediction accuracy or
group separation distance using the "B/W ratio" (as suggested by
Bijlsma et al.). The further away to the right of the distribution
formed by randomly permuted data, the more significant the discrimination. The p-value is calculated as the proportion of the times
that class separation based on randomly labeled sample is at least as good as the one based on the original data (one-sided p value).
Different methods use different criteria for ranking the features. The choice of method used can greatly affect the set of features
that are identified. This can be illustrated in the simple cases such as fold change v.s. t-tests, in which the former is interested in
absolute change in concentrations/intensities, while the latter focuses on changes relative to the underlying noises.
PLS-DA is based on linear regression; SAM and EBAM usually produce similar results since they are all based
on t statistics; both random forests and SVM are quite distinctive from all other methods by using an ensemble of classification trees
or projections to hyperplanes, respectively. Therefore, these methods tend to generate different results.
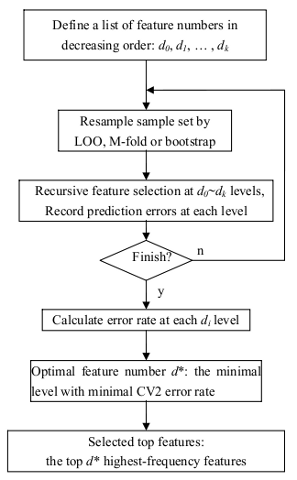
This is the workflow of RSVM algorithm described by Zhang X, et al..
Recursive SVM uses SVM for both classification and for selecting a subset of relevant genes according to their
relative contribution in the classification. This process is done recursively so that a series of data subsets and classification
models can be obtained in a recursive manner, at different levels of feature selection. The performance of the classification
can be evaluated either on an independent test data set or by cross validation on the same data set. R-SVM also includes
an option for permutation experiments to assess the significance of the performance. Please note, only linear kernel was used for
classification, since the information is usually far from sufficient for reliably estimating nonlinear relations for high-dimensional
data with a small sample size. First-order approximation will reduce the risk of overfitting in case of limited data.
CV2 refers to the cross validation embedded with the feature selection procedure as discussed above.
Cautions must be taken for the practice. If the features are selected based on the background biological knowledge,
it's fine to use the selected subset of data for classification. However, it is not proper to use the features
selected based on the whole dataset using some supervised methods (methods that utilize the class label information
such as t-tests, SAM, PLS-DA or other supervised classification methods). This procedure will introduce selection bias and result in a very optimistic
performance based on cross-validation due to "information leak". In order to obtain an objective performance evaluation,
one should include the feature selection procedure in the cross validation. Alternatively, one can evaluate the classifier using independent
dataset not used in the feature selections. These procedures were used by PLS-DA, random forest and R-SVM for feature
selection and classification. Currently, WEGAN does not support feature selection and classification using different
algorithms (i.e. PLS-DA for classification). This is going to be our next step. Please refer to
paper by Ambroise C and McLachlan GJ for a more detailed discussion.
However, one can use non-specific filtering (i.e. not using the class labels) to select features. We recently introduced
the Data filter function under the Data Process category. Users can use this function to remove low
quality features using a variety of criteria. Additionally, users can also try to remove sample outliers if exists using the
Data editor. These are safe procedures that can potentially improve the classification performance.

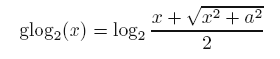 where a is a constant with a default value of 1.